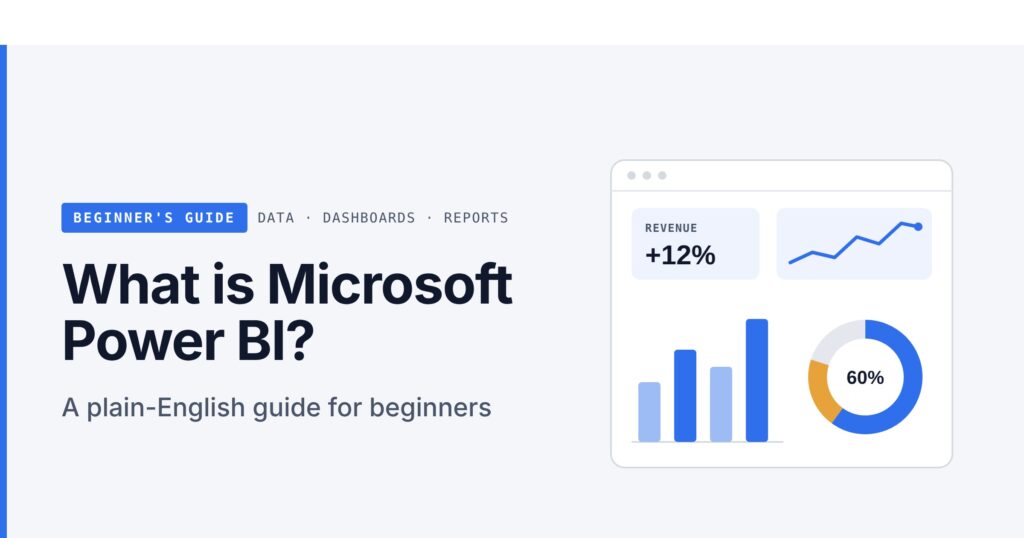
What Is Microsoft Power BI? A Plain-English Guide for Beginners
Power BI turns the numbers in your spreadsheets and business systems into clear, interactive charts. This plain-English guide explains what it is, how it works and how to start.

In this article
- Key takeaways
- What Power BI is, in everyday terms
- The “BI” in the name
- The main parts of Power BI
- Power BI Desktop
- Power BI service
- Power BI Mobile
- Report Builder and Report Server
- How Power BI works, step by step
- Reports versus dashboards: what is the difference?
- A report
- A dashboard
- Why Power BI matters for businesses
- Decisions based on facts, not hunches
- Less time copying, more time thinking
- One version of the truth
- Built-in AI help
- A note for Nigerian and African businesses
- Licences explained without the confusion
- Risks and things to watch
- Frequently asked questions
- Do I need to know coding to use Power BI?
- Is Power BI just a fancier Excel?
- Can I use it on a Mac?
- Where should I learn?
- Next steps: how to get started this week
- Sources
Most businesses already have plenty of data: sales records in Excel, customer lists in an accounting package, stock levels in a spreadsheet someone updates every Friday. The trouble is that raw numbers rarely tell you what to do next. Microsoft Power BI exists to close that gap. This guide is for business owners, managers, students and anyone who has heard the name in a meeting or a job advert and wants to understand it without jargon.
Key takeaways
- Power BI is Microsoft’s tool for turning data into pictures you can act on: charts, maps, tables and summary numbers that update as your data changes.
- It has three main parts: Power BI Desktop (free Windows app where reports are built), the Power BI service (the website where reports are shared) and Power BI Mobile (apps for viewing on phones and tablets).
- It can connect to more than 100 kinds of data source, from Excel files to databases and cloud services.
- A report is a detailed, multi-page view of one set of data; a dashboard is a one-page summary that can pull highlights from several reports.
- You can learn and build for free, but sharing with colleagues generally needs a paid licence such as Power BI Pro.

What Power BI is, in everyday terms
Microsoft describes Power BI as a business analytics platform that helps organisations connect to their data, visualise it and share what they find. In plain language, think of it as a very smart, very fast assistant who takes all your spreadsheets and records, tidies them up, links them together and then draws you a set of live charts showing what is really going on.
Imagine a pharmacy with three branches. Each branch keeps its daily sales in its own Excel sheet. At month end, the owner spends a weekend copying figures into one big sheet to see which products sold best and which branch is falling behind. With Power BI, those three sheets are connected once. From then on, a single screen shows total sales, sales by branch, best-selling products and slow-moving stock, and it updates whenever the data is refreshed. The owner can click on one branch and every chart instantly filters to show only that branch.
That is the heart of it: connect your data, shape it into something sensible, show it visually, and share it with the people who need to make decisions.
The “BI” in the name
BI stands for business intelligence, a long-standing term for the tools and practices that help organisations use their own data to make better decisions. Power BI is Microsoft’s product in that space, and it is also a core part of Microsoft Fabric, the company’s wider analytics platform for larger data projects.
The main parts of Power BI
Power BI is not one single program. It is a small family of tools that work together. Microsoft Learn lists them as follows.
Power BI Desktop
This is a free app for Windows computers and it is where most of the building happens. In Desktop you connect to your data, clean it, link tables together and design your reports. It includes a built-in cleaning tool called Power Query Editor and a formula language called DAX for calculations such as “profit margin” or “sales this month versus last month”. Beginners can get a long way with drag-and-drop before touching any formulas.
Power BI service
The service is the online side, reached in a web browser at app.powerbi.com. When a report is finished in Desktop, you publish it to the service. There, colleagues can open it, teams can work together in shared areas called workspaces, data can be set to refresh on a schedule, and people can subscribe to reports or set alerts. The service is also where dashboards are created.
Power BI Mobile
Mobile apps for phones and tablets let people view reports on the go. A sales manager visiting customers can check the latest figures without opening a laptop.
Report Builder and Report Server
Two more specialist tools exist. Power BI Report Builder creates “paginated” reports: fixed-layout, printable documents such as invoices or statements. Power BI Report Server lets organisations keep reports on their own servers instead of in Microsoft’s cloud, which some regulated businesses prefer. Most beginners will not need either at first.
How Power BI works, step by step
Microsoft’s own training describes a simple flow that almost every Power BI project follows. Here it is in plain words.
- Connect to your data. In Power BI Desktop, choose where your data lives: an Excel file, a CSV export from your accounting software, a SQL database, a SharePoint list or one of many online services.
- Clean and shape it. Real data is messy: misspelt branch names, blank rows, dates stored as text. Power Query Editor lets you fix these problems once, and Power BI remembers the steps so the same cleaning happens automatically every time the data refreshes.
- Build a model. This means telling Power BI how your tables relate. For example, a “Sales” table and a “Products” table are linked by product code, so the tool knows which sale belongs to which product. Microsoft now calls this organised data layer a semantic model (older material calls it a “dataset”).
- Create visuals and reports. Drag fields onto the page to make bar charts, line charts, maps, tables and big headline numbers called cards. Add slicers, which are simple on-screen filters such as a drop-down for month or region.
- Publish to the Power BI service. One click sends the report online.
- Share and manage. Give colleagues access, group related reports into an app, schedule refreshes and control who can see what.
Reports versus dashboards: what is the difference?
These two words cause more confusion than anything else for newcomers, so it is worth being precise. Microsoft’s documentation draws the line like this.
A report
- Can have one or many pages.
- Is built on a single semantic model.
- Is highly interactive: you can filter, slice, highlight and drill down into detail.
- Can be built in Power BI Desktop.
A dashboard
- Is always a single page, meant to show only the highlights.
- Exists only in the Power BI service, not in Desktop.
- Is made of tiles “pinned” from one or more reports, so it can combine highlights from different sources on one screen.
- Supports data alerts on certain tiles, which email you when a number crosses a threshold you set, such as stock falling below a reorder level.
- Cannot be sliced and filtered the way reports can; clicking a tile takes you to the report behind it for detail.
A simple way to remember it: the dashboard is the car’s instrument panel; the report is the mechanic’s full diagnostic printout.
Why Power BI matters for businesses
Decisions based on facts, not hunches
When the numbers are visible and current, conversations change. Instead of “I think sales are down in the north”, a manager can point to a chart and see by how much, since when and for which products.
Less time copying, more time thinking
Because cleaning steps and refresh schedules are saved, the end-of-month spreadsheet marathon can shrink dramatically. Staff spend their time asking questions of the data instead of assembling it.
One version of the truth
When everyone looks at the same published report, there are fewer arguments about whose spreadsheet is correct.
Built-in AI help
Power BI includes Q&A, which lets you type a question in ordinary language, such as “total sales by branch last month”, and get a chart back. Microsoft also offers Copilot, an AI assistant for generating insights and helping build reports, in Power BI and Fabric. As with any AI tool, check its answers against the underlying numbers.
A note for Nigerian and African businesses
Many SMEs across the region run on Excel, WhatsApp orders and a mix of local accounting tools. Power BI fits this reality well because it starts with the files you already have. A distributor in Kano, a school in Ibadan or a logistics firm in Nairobi can begin with a handful of spreadsheets. Two practical points: Desktop runs on Windows, and the online service needs an internet connection to publish and refresh, so plan refreshes for times when your connection is reliable.
Licences explained without the confusion
Licensing is where many people get stuck, so here is the simple version based on Microsoft’s licensing documentation. We have left prices out because they vary by country and change over time; check Microsoft’s site or a local Microsoft partner for current figures.
- Power BI Desktop is free to download.
- Free licence: you can connect to data and create reports and dashboards for your own personal use in “My Workspace”. You cannot share or collaborate with others.
- Power BI Pro: a per-person paid licence that lets you publish to shared workspaces and share and collaborate with other Pro users. For a small team, this is usually where things start.
- Premium Per User (PPU): adds most advanced Premium features for each person, but collaborators also need PPU.
- Capacity licences (Fabric F SKUs or Power BI Premium): bought for the organisation rather than per person. Content placed in a large enough capacity can be viewed by colleagues with free licences, which suits bigger organisations with many viewers.
Microsoft also notes that some Microsoft 365 subscriptions may already include a Power BI licence, so check what your business already pays for before buying anything new.
Risks and things to watch
- Garbage in, garbage out. A beautiful chart built on wrong data is still wrong. Fix data quality at the source where you can.
- Oversharing. Reports can contain salaries, customer details or profit margins. Use workspaces and permissions carefully, and use features such as row-level security so people see only the data meant for them.
- Account security. Power BI uses your Microsoft work account, so protect it with multi-factor authentication. Anyone who takes over that account can see your reports.
- Too many charts. A cluttered report hides the message. Start with three to five numbers that matter most.
Frequently asked questions
Do I need to know coding to use Power BI?
No. Connecting data, cleaning it and building charts is mostly point-and-click. The DAX formula language helps for more advanced calculations, but many useful reports need little or none of it.
Is Power BI just a fancier Excel?
Not quite. Excel is excellent for calculations and ad hoc work. Power BI is designed to combine data from many sources, refresh automatically and present interactive views that many people can use at once. Many businesses use both together.
Can I use it on a Mac?
Microsoft describes Power BI Desktop as a Windows app. Mac users can still view and work with content in the Power BI service through a web browser.
Where should I learn?
Microsoft Learn offers free official training modules, starting with “Get started with Power BI”, which follows the same build-publish-share flow described above.
Next steps: how to get started this week
- Pick one question your business needs answered, such as “Which products make us the most money?”
- Gather the data that answers it, usually one or two Excel files.
- Install Power BI Desktop on a Windows PC and connect it to those files.
- Clean the data in Power Query Editor and build one simple report page with a few cards, a bar chart and a slicer.
- Work through the free Microsoft Learn module alongside your own data; learning on real figures sticks better.
- When it proves useful, check whether your Microsoft 365 plan includes a Power BI licence, then publish and share with your team.
Start small, get one useful report in front of the people who make decisions, and build from there. That is how data turns into action.
Sources
- Microsoft Learn: What is Power BI?
- Microsoft Learn: Use Power BI (training module)
- Microsoft Learn: Introduction to dashboards for Power BI designers
- Microsoft Learn: Power BI service per-user and capacity-based licenses
- Microsoft Learn: Power BI service overview
Featured image: Photo: “Data chart: A year in the life of a weekend surfer” by Space & Light, CC BY 2.0, via Openverse — source
Was this article helpful?

Got expertise to share? Write for us →